Evidence of Footsteps2Brilliance-Driven Literacy Growth Across Texas Pre-K–3 Classrooms
Report Date: May 2026
EXECUTIVE SUMMARY
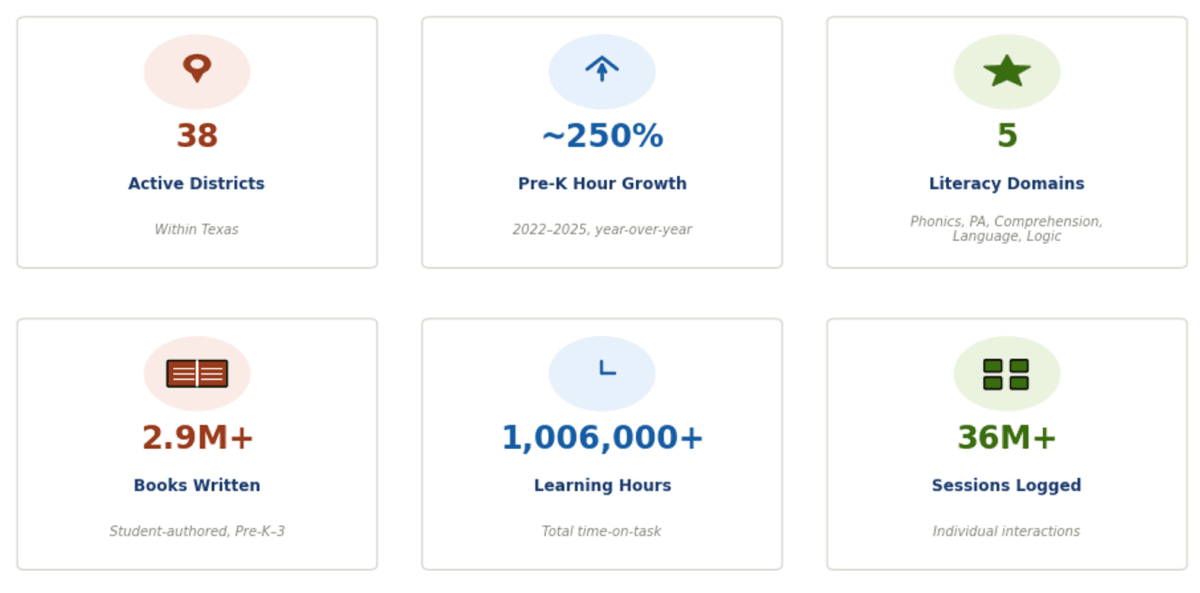
Across 38 Texas school districts, Footsteps2Brilliance (F2B) has delivered more than one million hours of structured early literacy instruction to Pre-K through Grade 3 students. This report presents F2B engagement data, measurable skill growth across five literacy domains, and a set of district spotlights drawn from communities where F2B has become a sustained, district-wide early literacy initiative with confirmed active usage. In these districts, Grade 3 ELA STAAR outcomes consistently exceed those of their peer districts who are not using F2B. The case for continued investment in Footsteps2Brilliance is grounded in confirmed data, aligned to HB3 mandates, and validated against Texas’s own Grade 3 reading results.
SECTION 1: THE TEXAS EARLY LITERACY IMPERATIVE
House Bill 3 and the Accountability Framework
Texas House Bill 3 (2019) represented the most significant investment in early childhood literacy in the state’s history. Its central message was simple: Start Early. The legislation established full-day Pre-K for eligible students, mandated phonics-based curriculum in Kindergarten through Grade 3, required all K–3 teachers to complete the Texas Reading Academies, and directed districts to adopt board-approved Early Childhood Literacy Plans. HB3 also restructured the Early Education Allotment, providing an additional per-pupil funding weight for economically disadvantaged and English Language Learner students served in Pre-K through Grade 2, to incentivize high-quality early literacy investment. Accountability runs through every provision: funding is tied to outcomes, and outcomes are measured early.
The legislative intent was unambiguous: create a structural pipeline from Pre-K through Grade 3 that ensures every Texas student arrives at third grade reading on grade level. The platform described in this report was designed and deployed to serve exactly that pipeline.
Where Texas Stands Today
In Texas, 51% of third graders are not yet reading at grade level. The state serves more than one million English Language Learners (ELLs), the second largest population in the nation. Historically, districts with high concentrations of ELL students have faced the greatest gaps in STAAR reading proficiency. But the most important story is where progress is happening.
Across the state, Footsteps2Brilliance is driving measurable gains in the very districts that have traditionally struggled the most, those serving high concentrations of ELL and economically disadvantaged students. In fact, the strongest outcomes in this report come from these high-need districts where Footsteps2Brilliance is implemented with fidelity. This is where the F2B is making the greatest difference by accelerating literacy, closing gaps, and proving that with the right tools, even the most at-risk students can succeed.
Why Pre-K Through Grade 3 Is an Investment That Matters
Decades of reading research converge on a singular conclusion: the window between birth and Grade 3 is when the brain is most receptive to foundational literacy acquisition. Phonological awareness, phoneme-grapheme correspondence, vocabulary development, and narrative comprehension are all more efficiently acquired in these years than at any subsequent point. Districts that front-load high-quality, high-frequency literacy instruction produce demonstrably stronger Grade 3 readers. From a Return on Educational Investment perspective, these proactive districts create financial efficiency and do not spend the subsequent years and budgets in remediation. Too often, core instruction, interventions, extended learning, and at-home practice operate in silos, fragmenting the learning experience and undermining the continuity required for strong literacy outcomes.
SECTION 2: FOOTSTEPS2BRILLIANCE SCALE ACROSS TEXAS
A Statewide Footprint Built Over More Than a Decade
Footsteps2Brilliance entered Texas in 2013 and has grown to serve 38 active school districts, spanning the Rio Grande Valley, the Dallas-Fort Worth metroplex, the Gulf Coast, and rural communities across the state.
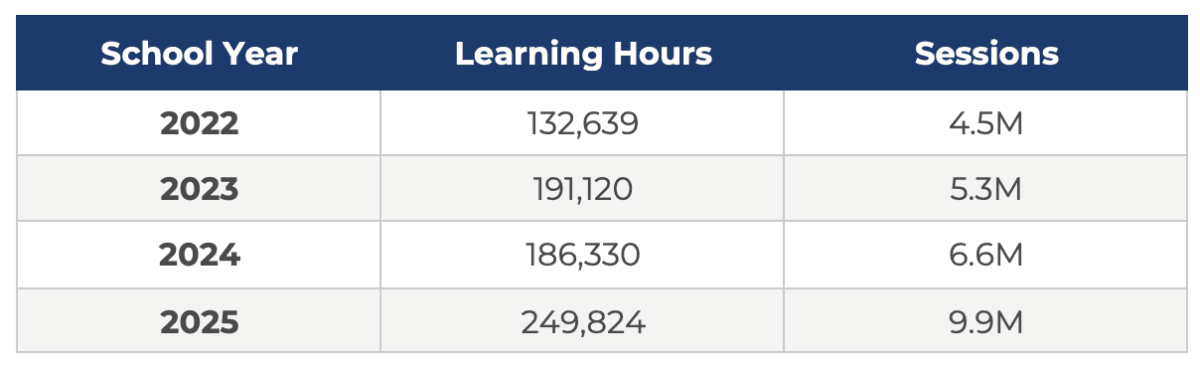
Three-Year Growth Trajectory
The consistent growth in both students served and hours logged reflects sustained district investment. Teachers and administrators see the value because the platform reduces preparation time and provides curriculum cohesiveness while producing measurable classroom outcomes. The sharp increase in 2025 represents districts doubling down on early literacy investment in the same year HB3’s accountability requirements reached full implementation.
SECTION 3: MEASURED LITERACY OUTCOMES
Platform Skill Growth Across Five Domains
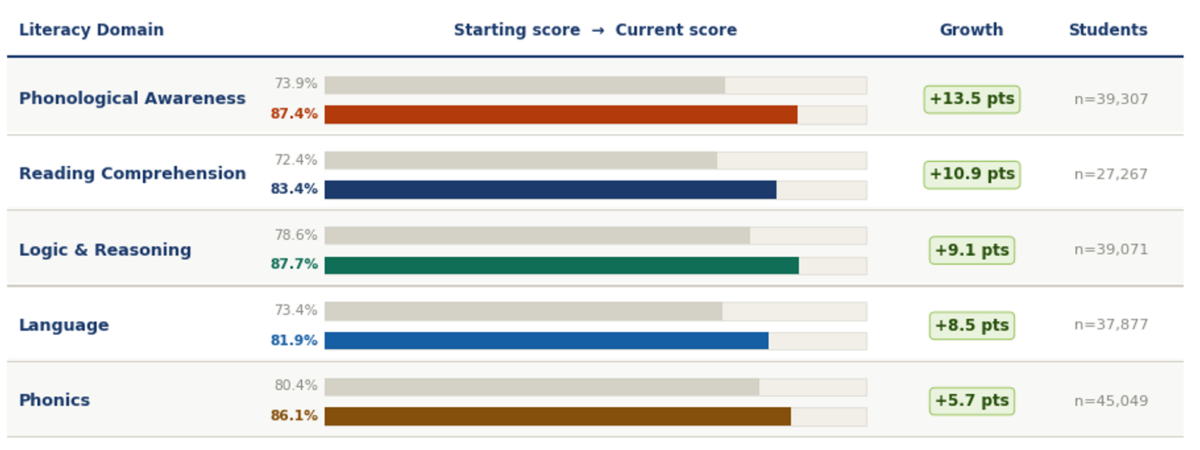
The Footsteps2Brilliance platform (Platform) assesses students at first interaction (initial score) and tracks their most recent performance over time (recent score). This captures real growth within the platform. The table below aggregates those scores across all Texas F2B students in Pre-K through Grade 3.
What the Growth Numbers Mean
A 13.5-point gain in Phonological Awareness is not a marginal improvement. Phonological awareness is one of the strongest and most consistent predictors of early reading success and serves as a critical foundation for decoding and phonics development. This gain, across nearly 40,000 students, is the platform’s most consequential outcome.
The 10.9-point gain in Reading Comprehension, achieved across more than 27,000 students, reflects the platform’s capacity to build not just decoding skills but meaning-making abilities, which are the skills that ultimately determine whether a student passes Grade 3 STAAR RLA. To put both figures in context: Texas’s statewide Grade 3 STAAR recovery from 2024 to 2025 was +3 percentage points. F2B’s internal skill growth rates run at 3.6 to 4.5 times that statewide recovery rate in the same students, the same districts, the same year.
Phonics shows the smallest growth delta not because students are learning less, but because they begin with higher initial scores (80.4%). The platform’s Digital-to-Real-World design ensures phonics skills practiced on-screen translate directly into classroom decoding behavior, reinforcing mastery rather than remediating weakness.
SECTION 4: WHERE F2B IS WORKING — STAAR RESULTS
A Pattern Across Sustained Deployments
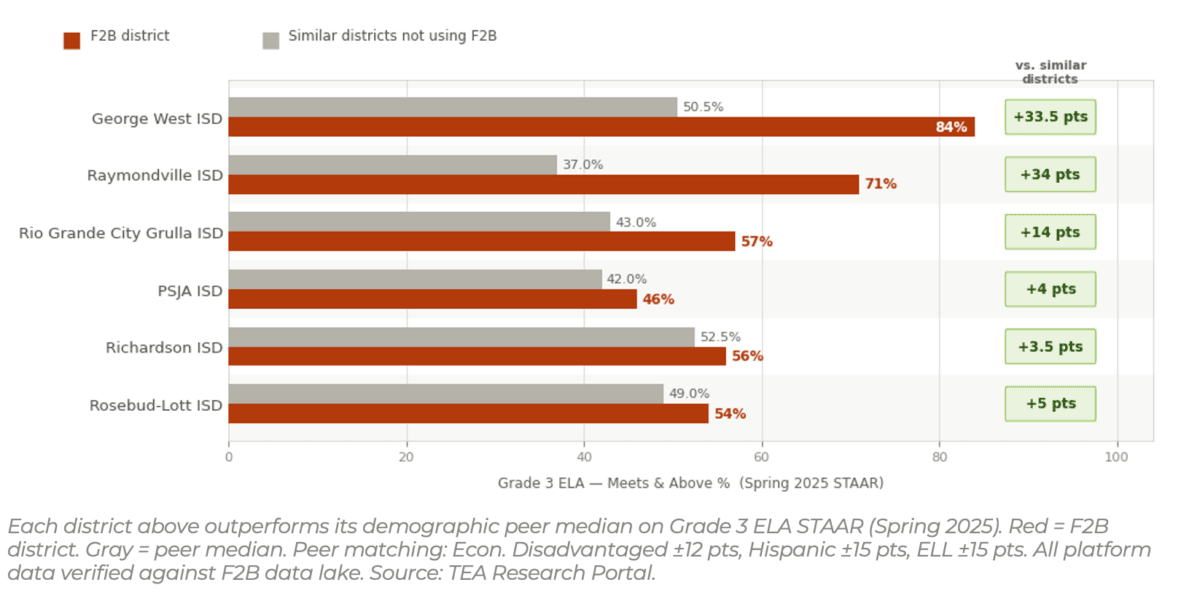
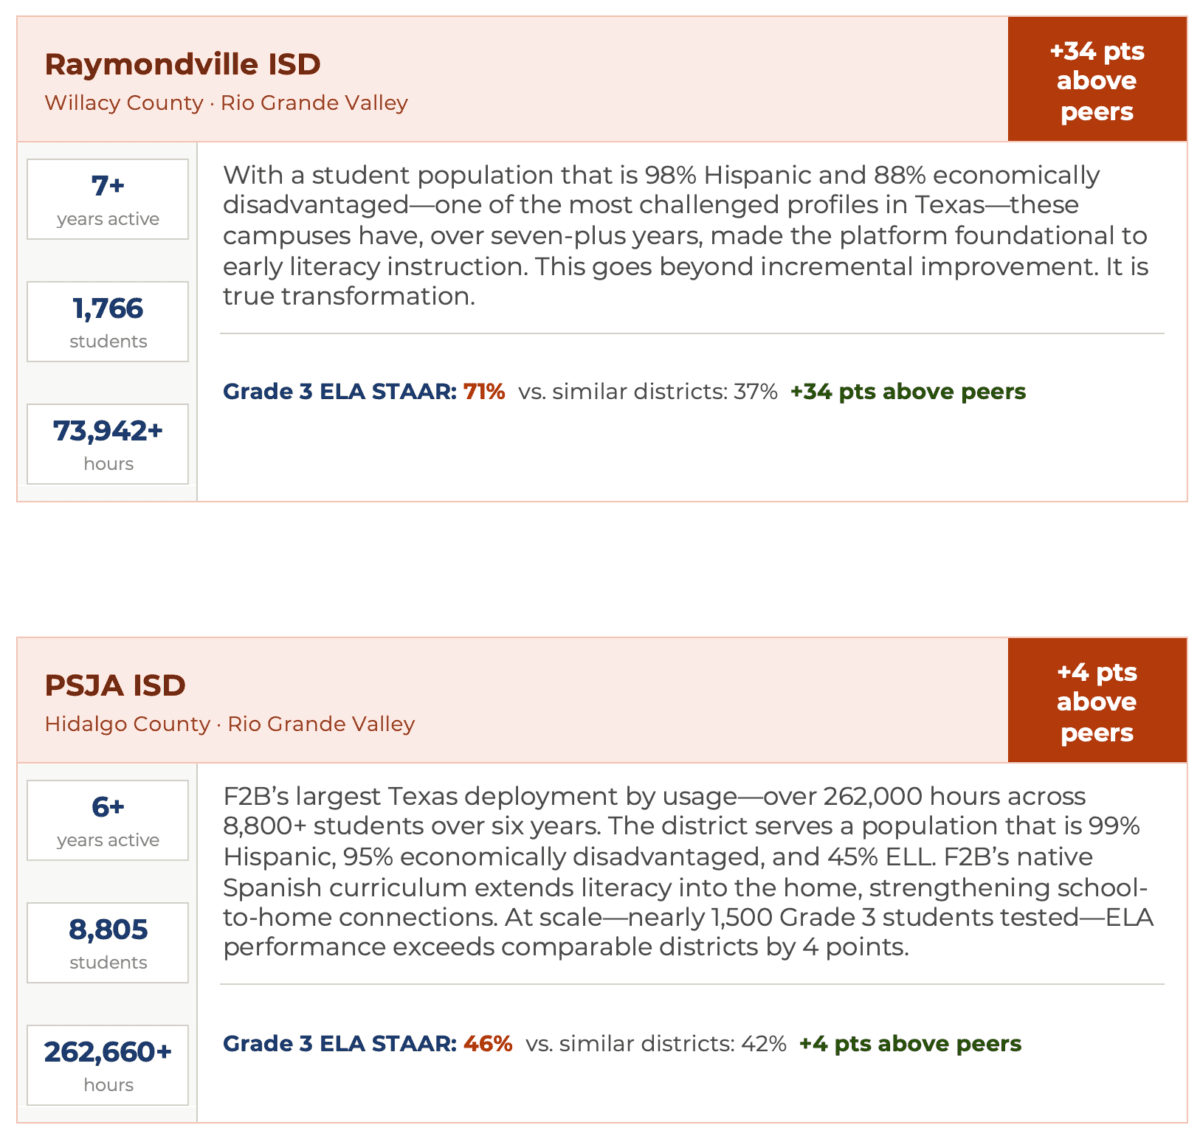
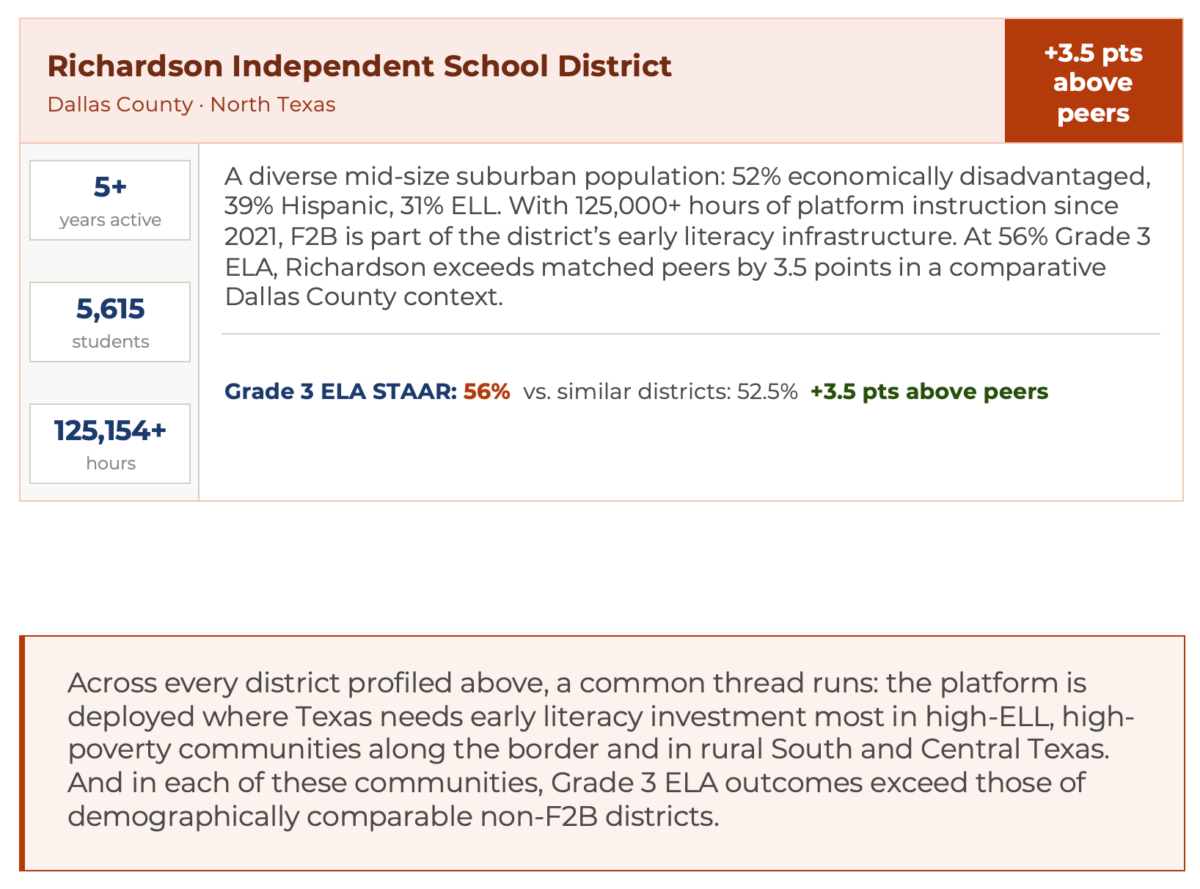
Across F2B’s Texas footprint, a consistent pattern emerges in districts where the platform has become embedded in early literacy instruction over multiple years: Grade 3 ELA outcomes exceed those of demographically comparable districts. The following profiles illustrate that pattern. Each district featured here shares a common profile: Footsteps2Brilliance has been deployed as a district-wide early literacy initiative with confirmed active usage, and F2B reach extends to a substantial share of the district’s Pre-K through Grade 3 enrollment. These are the conditions under which F2B’s impact is most attributable and most measurable.
For each Footsteps2Brilliance district, Grade 3 ELA peer districts are provided. This benchmark reflects the median percentage of students scoring “Meets and Above” on the Grade 3 STAAR ELA assessment among non-F2B Texas districts with similar demographics that are matched across three key factors: Economically Disadvantaged %, Hispanic %, and ELL %.
This methodology mirrors the Texas Education Agency’s Comparative Improvement framework, which compares districts based on shared demographic challenges rather than test score outcomes. Charter schools are excluded from all peer groups to eliminate potential bias from selective enrollment.
ELA STAAR Results: District Spotlights
Why this comparison is the right one
A raw comparison against the Texas statewide average (52.2% Grade 3 ELA) would be misleading. F2B’s districts are high-ELL, high-poverty communities that structurally score below affluent suburban averages, not because the platform is underperforming, but because these are the hardest districts to serve in the state. Comparing them to their actual demographic peers, districts facing the same poverty rates, the same language barriers, the same community challenges, is an accurate measure of what the platform achieves.
SECTION 5: SERVING THE STUDENTS TEXAS IS MOST ACCOUNTABLE FOR
The Emergent Bilingual Majority
Texas serves more than one million emergent bilingual students—the second-largest ELL population in the nation. In many Footsteps2Brilliance districts, Spanish is the primary home language for a significant share of students.
Footsteps2Brilliance is designed to meet this reality. Its curriculum supports both English and Spanish through a seamless, page-by-page toggle, enabling students to learn in either language at any moment. This is family engagement in its most practical form: when students use the platform at home in the language their families speak, literacy instruction naturally extends beyond the classroom and into the household. Parents become active participants in their child’s learning—not bystanders.
Texas policy reinforces this approach. Under HB3, the Early Education Allotment provides an additional 0.20 funding weight for emergent bilingual students in Pre-K through Grade 2. This intentional investment was designed to support exactly this kind of aligned, school-to-home literacy development.
Pre-K as the Point of Maximum Leverage
The platform’s usage in Texas is intentionally concentrated in Pre-K and Kindergarten, where literacy research is most definitive and where HB3’s investment priorities are most clearly focused. Districts are using Footsteps2Brilliance as a true prevention strategy: building phonological awareness, vocabulary, and early comprehension skills that make every subsequent year of instruction more effective.
Phonological Awareness, the domain most heavily emphasized in these early years, shows the strongest gains: +13.5 percentage points across nearly 40,000 students. That is 4.5 times the statewide Grade 3 STAAR recovery rate of +3 points in 2025. It is exactly the kind of outcome a well-implemented early literacy strategy should deliver.
SECTION 6: CONCLUSION AND RECOMMENDATIONS
What the Evidence Supports
- Finding 1: In districts where Footsteps2Brilliance has been deployed as a sustained, district-wide early literacy initiative with confirmed active usage, Grade 3 ELA STAAR outcomes consistently exceed those of demographically matched peers. The strongest results span border communities and rural Texas alike: George West ISD (+33.5 pts vs. peers), Raymondville ISD (+34), Rio Grande City Grulla ISD (+14).
- Finding 2: Outcomes + Data: across all Texas F2B students in Pre-K through Grade 3, the platform produces 5.7–13.5 point skill gains in every literacy domain, with growth rates running at 3.6 to 4.5 times the statewide STAAR recovery rate.
- Finding 3: Footsteps2Brilliance is deployed disproportionately in the highest-need communities in Texas (high-ELL, high-economically-disadvantaged districts) and is producing positive, peer-validated Grade 3 outcomes in those communities.
Recommendations for District Leaders
- Districts should evaluate expanding F2B to district-wide implementation. The platform’s impact compounds over time and across enrollment. The districts with the strongest Grade 3 outcomes are those where deployment is deepest and most sustained.
- Districts considering adoption should explore how Texas’s HB3 Early Education Allotment, approximately $800 million annually in flexible formula funding, can support the Pre-K expansion and early literacy infrastructure that F2B is built to serve.
Footsteps2Brilliance
A platform front-loading literacy investment where Texas needs it most, producing outcomes validated against Texas’s own Grade 3 reading data.
APPENDIX: DATA SOURCES AND METHODOLOGY
TEA Grade 3 STAAR Data
F2B district figures are drawn from the Texas Academic Performance Report (TAPR) 2024-25, Grade 3 Reading, Meets and Above, District column. This is the official all-students figure that appears on each superintendent’s own accountability report, combining both English and Spanish STAAR takers.
Peer median figures are drawn from the TEA Research Portal, Grade 3, Spring 2025, English Reading, district level. Statewide reference: 52.2% weighted (189,557 meets / 363,267 tested), 49.0% district median. Districts with fewer than 10 students tested excluded. 1,098 valid Texas districts.
The two sources are consistent. Peer districts serving similar high-ELL communities also have Spanish testers, and validation confirms that recalculating peer medians on an all-students basis shift results by less than one point. All F2B districts are excluded from all peer pools.
District Spotlight Selection
Districts featured in Section 4 satisfy all of the following criteria, verified against the F2B data lake prior to inclusion: (1) confirmed active platform usage through 2024 or later; (2) a minimum of 200 distinct student users and 1,000 learning hours; (3) deployment as a district-wide initiative rather than a single-campus pilot; and (4) inclusion in a matched peer comparison where Grade 3 ELA STAAR performance is evaluated against demographically similar districts not using F2B. These criteria were established and applied before reviewing STAAR outcomes.
Peer Figure Calculation
The peer median cited for each district in Section 4 is the median Grade 3 ELA STAAR Meets and Above percentage among non-F2B Texas districts matched to that district on three demographic dimensions simultaneously:
- Economically Disadvantaged % matched within ±12 percentage points. The single strongest structural predictor of STAAR performance. Derived from TEA 2025 STAAR All-Subjects district file.
- Hispanic % matched within ±15 percentage points. Controls for community language background and demographic composition associated with ELL enrollment.
- ELL % matched within ±15 percentage points. Controls for English learner instructional load.
All three conditions are satisfied simultaneously. Charter schools, online academies, and alternative preparatory programs are excluded from peer pools to remove selective-enrollment bias. Peer pools require a minimum of five qualifying districts with at least 25 Grade 3 students tested. Peer metric = pool median. This approach mirrors TEA’s own Comparative Improvement accountability framework. All F2B districts are excluded from all peer pools.
F2B Platform Data
All Footsteps2Brilliance usage and skill metrics were queried directly from the F2B data lake in April 2026. All calculations performed on confirmed transaction-level records. No estimates or projections are used for any quantitative claim. Platform-wide statistics in Sections 2 and 3 reflect the full Texas F2B footprint.
For questions about methodology or data access, contact Footsteps2Brilliance at footsteps2brilliance.com.